
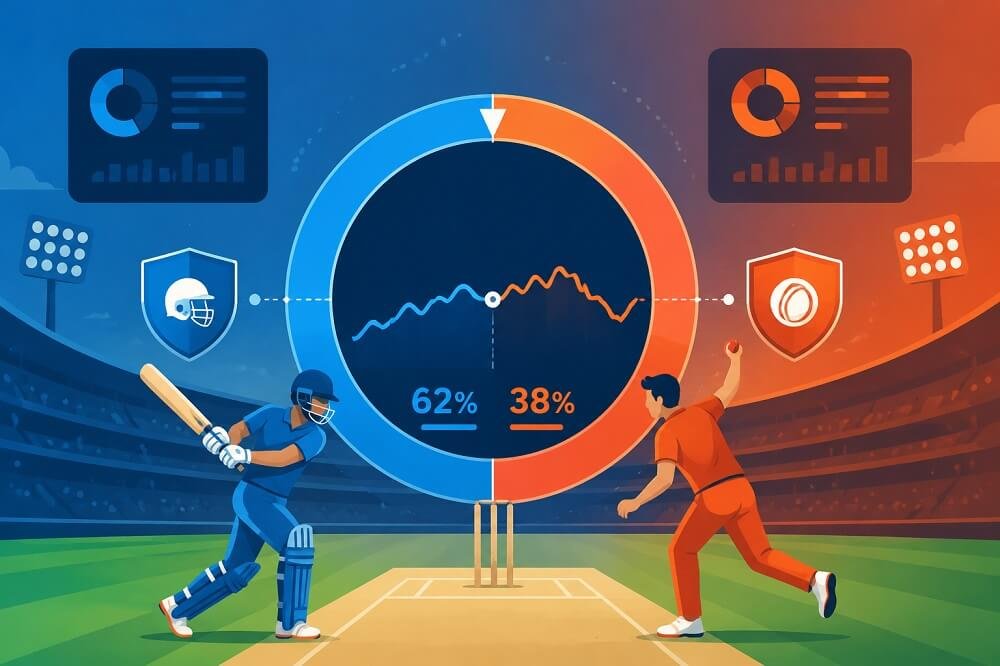
When cricket fans search for the win probability of today’s match, they are usually looking for more than a simple prediction. They want to know which team has the better chance of winning and, more importantly, why.
Modern cricket analytics can estimate a team’s probability of winning by combining historical results, current match conditions and live information. Depending on the model, inputs can include the score, wickets, overs remaining, required run rate, team strength, player quality, venue, toss and other match-specific factors.
But win probability is not the same as certainty.
A team with a 70% win probability can still lose. A team with a 30% probability can still produce an unexpected victory. Probability describes the estimated likelihood of an outcome based on the information available at that moment.
This guide explains how cricket win probability is calculated, what factors influence it, how live win probability changes during a match and how to interpret the numbers correctly in 2027.
What Is Cricket Win Probability?
Cricket win probability is an estimate of how likely each team is to win a match.
For example, a model might produce:
- Team A: 65% win probability
- Team B: 35% win probability
This does not mean Team A is guaranteed to win.
It means that, according to the model and the information used, Team A is estimated to have a higher likelihood of winning at that particular point.
Win probability can be calculated before a match begins and updated throughout the game.
Pre-Match Win Probability
Before the first ball, a model might consider:
- Team strength
- Recent performance
- Player availability
- Venue
- Historical performance
- Playing conditions
- Toss information, when available
- Expected line-ups
- Format-specific performance
Live Win Probability
Once the match starts, the model can incorporate real-time information such as:
- Current score
- Overs completed
- Wickets lost
- Runs required
- Balls remaining
- Current run rate
- Required run rate
- Batters and bowlers involved
- Match situation
This is why a team’s win probability can move dramatically during a cricket match.
How Is Win Probability Calculated?
There is no single universal formula for every cricket prediction model.
Different analysts and data providers can use different statistical or machine-learning approaches.
At a simplified level, the model estimates:
Probability of Team A winning = f(match state, team strength, players, conditions and historical data)
The model converts these inputs into an estimated probability between 0% and 100%.
A sophisticated system may use logistic regression, Bayesian methods, gradient-boosting models, neural networks or simulations. The exact methodology depends on the provider.
The important concept is that the probability is model-generated, not a guaranteed forecast.
The Most Important Factors in Cricket Win Probability
1. Current Score
The score is one of the most obvious inputs.
A team chasing 180 at 100/2 is in a different position from a team chasing 180 at 100/7.
The same number of runs can therefore produce very different win probabilities depending on the number of wickets remaining and balls left.
2. Wickets Remaining
Wickets represent an important batting resource.
A team with several wickets in hand generally has more opportunity to continue scoring than a team close to being bowled out.
This becomes particularly important during a chase.
For example:
Scenario A: 80 runs required with 8 wickets remaining.
Scenario B: 80 runs required with 2 wickets remaining.
The two situations have the same number of runs required, but their win probabilities would not normally be identical.
Research into cricket scoring and resource models also shows why overs remaining and wickets are important components when assessing a team’s available resources.
3. Overs and Balls Remaining
Time is another major factor.
In limited-overs cricket, a chasing team has a fixed number of deliveries available.
If a team needs 60 runs from 60 balls, the required rate is 6 runs per over.
If it needs 60 runs from 30 balls, the required rate is 12 runs per over.
The second situation generally creates considerably more pressure.
4. Required Run Rate
Required run rate is especially important during a chase.
A simplified calculation is:
Required Run Rate = Runs Required ÷ Overs Remaining
For example, if 72 runs are required from 12 overs:
72 ÷ 12 = 6 runs per over
If only 6 overs remain:
72 ÷ 6 = 12 runs per over
As the required rate rises, the model may reduce the chasing team’s estimated probability, although the effect depends on many other variables.
5. Current Run Rate
The team’s scoring rate provides additional context.
A chasing side that needs 8 runs per over but has recently been scoring at 10 runs per over may be in a different position from a team that needs 8 but has scored only 5 per over recently.
However, models should be careful about overinterpreting short-term momentum because cricket contains substantial randomness.
6. Team Strength
Pre-match models can consider the relative strength of the teams.
Possible indicators include:
- Win percentage
- Recent results
- Batting strength
- Bowling strength
- Fielding performance
- Format-specific record
- Strength of opposition
- Home and away performance
A team with a stronger long-term record may begin with a higher pre-match probability, but current match conditions can quickly change that estimate.
7. Player Quality and Availability
Individual players can influence a team’s expected performance.
A model may consider factors such as:
- Batting average
- Strike rate
- Bowling average
- Economy rate
- Recent performances
- Player role
- Expected playing XI
- Injuries or unavailability
The impact of a player can also depend on the match situation.
For example, the presence of a specialist death bowler may be particularly relevant late in a T20 innings, while a top-order batter may have greater importance early in a chase.
8. Venue
The ground can influence win probability.
Models may consider:
- Average first-innings score
- Chasing record
- Boundary dimensions
- Pitch characteristics
- Spin versus pace performance
- Historical scoring patterns
- Home-team advantage
Venue data should be used carefully because historical performance does not guarantee future results.
9. Toss
The toss can sometimes influence pre-match probability, particularly when the decision to bat or bowl interacts with local conditions.
Research has found that the toss can have a measurable but context-dependent relationship with match outcomes. One large historical study estimated an average winning advantage associated with winning the toss, while also finding that the effect varied according to conditions and how closely matched teams were.
The toss should therefore be treated as one factor rather than a guaranteed advantage.
10. Match Format
A win-probability model should account for the format.
T20, ODI and Test cricket have very different match dynamics.
For example:
T20: Every delivery can have a substantial impact because only 120 legal balls are available in a standard innings.
ODI: Teams have more deliveries and greater opportunity to recover from setbacks.
Test: Time, wickets, declarations, innings and changing pitch conditions create a very different probability structure.
A model designed for T20 cricket should therefore not simply be transferred to Test cricket without adjustment.
How Live Win Probability Changes During a Match
One of the most interesting aspects of cricket analytics is that win probability can change after almost every significant event.
Imagine a T20 chase.
Start of Innings
Team B begins with a 48% probability of winning.
After the Powerplay
Team B reaches 60/1.
The model might increase its probability because the team has scored efficiently while losing only one wicket.
Middle Overs
The batting side then loses three wickets quickly.
Its estimated probability could fall.
Final Overs
Suppose 35 runs are required from 18 balls.
The model now considers:
- Runs required
- Balls remaining
- Wickets remaining
- Batters at the crease
- Bowling resources
- Recent scoring
- Historical scoring distributions
The probability may shift again.
Final Over
If the team requires 10 runs from 6 balls, the probability is likely to be very different from the figure shown at the start of the innings.
This demonstrates why today’s cricket win probability is not a fixed number.
It is a moving estimate.
A Simple Example of Win Probability
Consider a hypothetical T20 match.
Team A scores: 185/7
Team B begins its chase.
After 10 overs, Team B is: 95/2
Team B therefore needs: 91 runs
from: 60 balls
The required run rate is: 91 ÷ 10 = 9.1 runs per over
A probability model could then combine the required rate with wickets remaining, team strength, current scoring rate and other variables.
The final probability might be something like: Team A: 55% , Team B: 45%
The exact number would depend on the model and its training data.
The example is illustrative rather than a real prediction.
Why Two Win Probability Models Can Give Different Answers
You may see one website showing a team at 62% while another shows 55%.
That does not necessarily mean one source is wrong.
Different models can use different:
- Historical datasets
- Features
- Weightings
- Algorithms
- Match simulations
- Player ratings
- Venue adjustments
- Calibration methods
One model might emphasize current match conditions, while another could give more weight to historical team strength.
Therefore, users should understand the methodology behind a probability figure before comparing different providers.
How AI Is Used in Cricket Win Probability
Modern cricket analytics increasingly uses machine learning to process large amounts of historical and live data.
A model can be trained using previous matches and their outcomes.
The training data may contain information such as:
- Match format
- Teams
- Venue
- Score
- Wickets
- Overs
- Run rate
- Required run rate
- Players
- Innings state
- Final result
The trained model can then estimate the probability of winning for a new match state.
Some modern cricket analytics systems use dozens of real-time variables to update probability estimates during T20 matches.
What Is a Good Win Probability Model?
A useful model should not simply produce confident-looking numbers.
It should be:
Accurate
Its predictions should perform well against historical results.
Calibrated
If a model gives teams a 70% probability across many comparable situations, those teams should win roughly 70% of those matches over a sufficiently large sample.
Updated
Live models should respond to meaningful changes in the match.
Transparent
Users should ideally understand what major factors influence the estimate.
Format-Aware
A T20 model should account for the specific characteristics of T20 cricket rather than treating every format identically.
Win Probability Is Not the Same as a Prediction
The terms are often used interchangeably, but there is an important distinction.
A prediction might say:
Team A will win.
A probability estimate says:
Team A has an estimated 68% chance of winning.
The second statement acknowledges uncertainty.
Even a 90% probability does not mean the result is certain.
Unexpected events are part of sport.
Does Win Probability Guarantee the Winner?
No.
Win probability is an estimate, not a guarantee.
Suppose a model gives:
- Team A: 80%
- Team B: 20%
Team B still has a 20% estimated chance under that model.
That is why a lower-probability team can win without the model necessarily being “wrong.”
A probability model should be evaluated across many matches rather than judged from one surprising result.
How to Find Today’s Cricket Match Win Probability
If you want to understand how in-play markets work alongside live match data, read our live cricket betting guide for a step-by-step explanation of live cricket markets and changing odds.
When researching platform-specific cricket content, our Play99 provides additional information about cricket betting and in-play markets.
For live win probability, always check the match, current score, latest update time and methodology behind the probability figure.
If you are searching for the win probability of today’s match, look for a source that clearly identifies:
- The teams
- Match format
- Venue
- Match date
- Current score, if the game has started
- Probability for both teams
- Time of the latest update
- Methodology or model information
For live matches, the timestamp is particularly important.
A probability displayed before a wicket may be substantially different from the probability after that wicket.
Pre-Match vs Live Win Probability
| Factor | Pre-Match Probability | Live Probability |
|---|---|---|
| Team strength | Important | Still relevant |
| Recent form | Important | Relevant |
| Venue | Important | Relevant |
| Toss | May be included | Already known |
| Current score | Not available | Major factor |
| Wickets | Not available | Major factor |
| Balls remaining | Not available | Major factor |
| Required run rate | Not available | Major factor |
| Live player situation | Limited | Important |
| Updates | Before match | Continuously during match |
Live probability generally has access to more information because part of the match has already been played.
How Rain and DLS Can Affect Probability
Weather interruptions can make cricket probability models more complicated.
In limited-overs cricket, the Duckworth-Lewis-Stern approach uses resources associated with overs and wickets to help establish revised targets when matches are interrupted.
Research describing the D/L framework explains its use of remaining overs and wickets as measures of batting
A win-probability model therefore needs to account for the revised match situation when rain changes the number of available overs.
Common Mistakes When Reading Win Probability
Mistake 1: Treating 60% as a Guarantee
A 60% probability still leaves substantial room for the other team to win.
Mistake 2: Looking Only at Team Names
Current match conditions can matter much more than pre-match reputation.
Mistake 3: Ignoring Wickets
A score without wickets can be misleading.
Mistake 4: Ignoring Balls Remaining
The required runs mean little without knowing how many deliveries remain.
Mistake 5: Comparing Different Models Without Checking Methodology
Different models may produce different estimates because they use different inputs and algorithms.
Mistake 6: Using Old Probability Data
Live probability can become outdated quickly.
Always check the timestamp when using a live figure.
Final Thoughts
The win probability of today’s cricket match is best understood as a continuously changing statistical estimate rather than a guaranteed prediction.
Modern cricket models can combine team strength, player information, venue characteristics and historical data with live match conditions such as score, wickets, overs remaining and required run rate.
The result is a percentage that helps explain how the balance of a match is changing.
For readers in 2027, the most useful win-probability pages will be those that do more than display two percentages. They should identify the match, show when the data was updated, explain the main factors behind the estimate and make the limitations of probability clear.
In cricket, uncertainty is always part of the game. A strong probability model does not eliminate that uncertainty—it helps us understand it.
Frequently Asked Questions
What is win probability in cricket?
Cricket win probability is a statistical estimate of how likely each team is to win a match based on available information.
How is today’s cricket match win probability calculated?
It can be calculated using factors such as team strength, historical performance, venue, toss, current score, wickets, overs remaining, required run rate, player information and other match-state variables.
Can win probability change during a cricket match?
Yes. Live win probability can change after important events such as wickets, boundaries, changes in required run rate and other match developments.
Is cricket win probability accurate?
A good model can provide useful statistical information, but no model can guarantee a result. Accuracy should be assessed over a large number of matches rather than a single game.
What is the difference between win probability and match prediction?
A prediction may identify a likely winner, while win probability expresses the estimated likelihood numerically. For example, a model could give Team A a 65% probability and Team B a 35% probability.
Does the toss affect cricket win probability?
It can. The effect varies by venue, format, conditions and the relative strength of the teams. The toss should be treated as one input among many rather than a guaranteed advantage.
Does win probability help with live cricket analysis?
Yes. Live probability can provide a statistical way to understand how the match situation changes after runs, wickets and other events. However, it remains an estimate rather than a certainty.